Finance
track receivables, ageing and cash trends

Global Search
Present timely operational information with context.
Good dashboards prioritise actionable measures, clear comparisons, appropriate access and paths back to underlying records.
Request a consultation →Related service →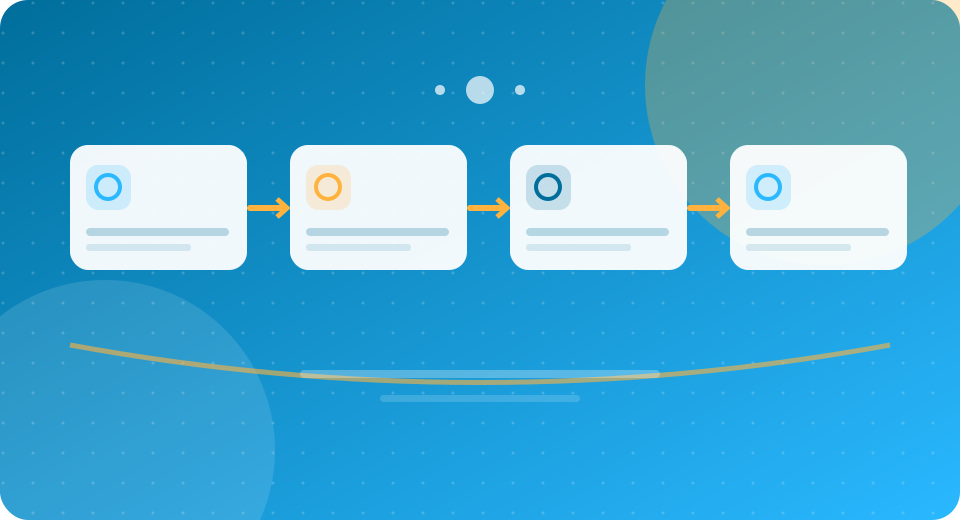
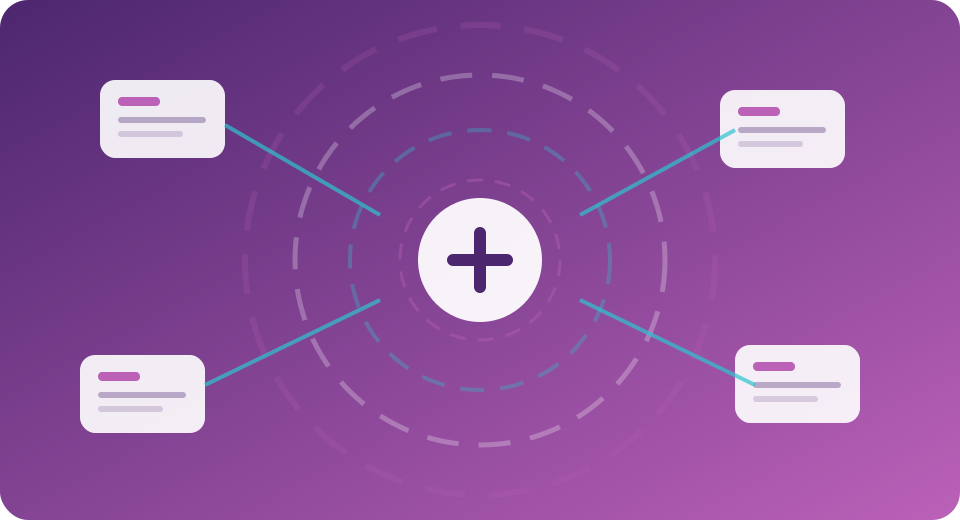
Good dashboards prioritise actionable measures, clear comparisons, appropriate access and paths back to underlying records. Organise dashboards around decisions, trends, exceptions and underlying transaction evidence.
Organise dashboards around decisions, trends, exceptions and underlying transaction evidence.
Prioritise meaningful measures, filters, alerts and accessible presentation.
Technology decisions should improve day-to-day work, strengthen data reliability and support measurable business outcomes.
Show relevant information to executives, managers and operational users
Display definitions, date ranges and comparison baselines
Highlight deviations that need investigation or response
Provide usable filters, readable layouts and controlled data exports
A simplified reference flow, adapted to the actual project requirements:
Illustrative architecture, not a claim of an existing deployed installation.
Depending on business requirements, solutions may be designed using relevant industry technologies and architectural patterns:
These are recognised industry technologies and architectural approaches that may be evaluated for a project; their mention does not imply Core1 Solutions has deployed, certified, partnered with, or currently supports every named technology.
Different sectors apply the same technical foundations to different operational challenges.
track receivables, ageing and cash trends
monitor deliveries, delays and exceptions
measure appointment volumes and waiting times
Review users, processes, existing systems, constraints and priorities.
Audience-based reporting design, metric catalogue, dashboard wireframes and refresh requirements.
Test security, data integrity, performance and real-world workflows.
Document ownership, support needs and continuous improvements.
Enough to support the intended decision without overwhelming the user.
Yes, with permissions, consistent filters and appropriate data protection.
Use clear scales, definitions, comparisons and links to underlying records.
See how this capability can complement Core1ERP, business applications and professional services.
Tell Core1 Solutions about your environment, requirements and business goals.
Request a consultation →